
The claim reviewed
Can this map, published after the explosion on 4 August 2020, tell us that individual buildings were destroyed? The answer depends on how the colours were produced and how much ground each cell covers.
Key findings
- The coloured areas were derived from changes between radar records before and after the explosion.
- NASA describes each coloured cell as representing an area of 30 × 30 metres.
- UNOSAT finds damage in separate satellite photographs but says field validation is needed.
The photograph and the damage map
The explosion at Beirut’s port on 4 August 2020 caused severe damage nearby. The ARIA and Earth Observatory of Singapore team then prepared a damage map from satellite records. Such a map helps identify areas to examine during assessment and relief work.
The image below is a photograph taken from the International Space Station on 11 August. It helps locate the coast and the port within the city. The colours in the damage map examined next come from radar analysis, rather than the surface colours seen in the photograph.
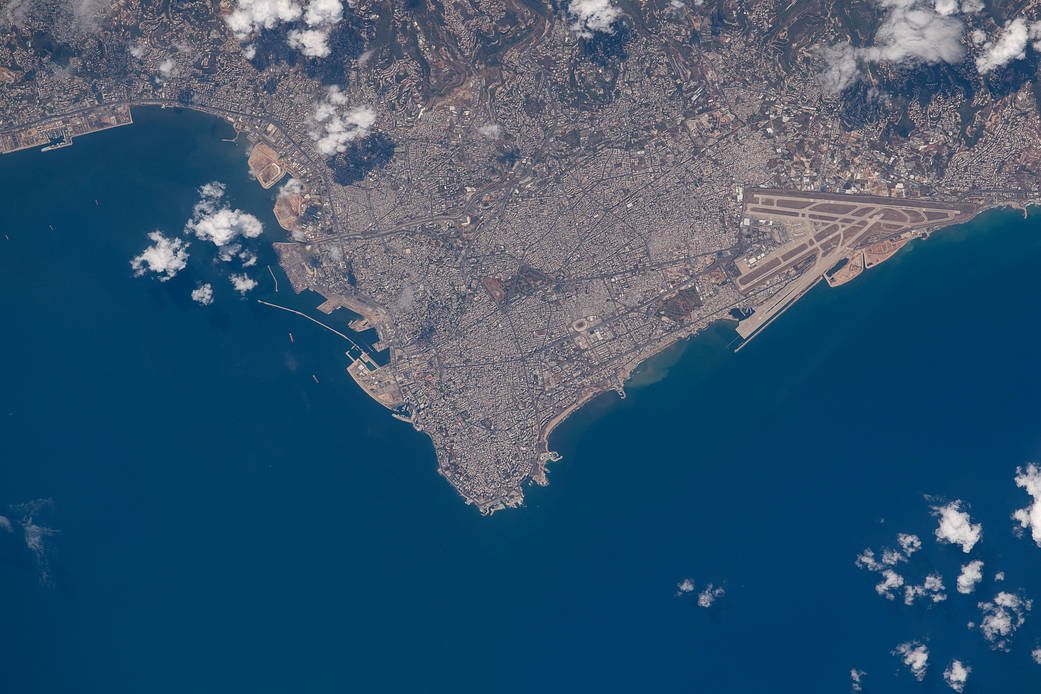
NASA/JPL - NASA Maps Beirut Blast Damage (7 August 2020)NASA - Beirut, Lebanon (12 August 2020)
How were the colours around the port produced?
Radar works by sending a signal and measuring its return. Changes to the surface can affect that return. The ARIA and Earth Observatory of Singapore team compared records from before and after the explosion to identify likely damage areas. NASA Earth Observatory gives the period used as 29 July–5 August 2020.
In the port detail, red and orange marks are concentrated around the harbour. That information can help teams choose an area for closer inspection. Establishing the condition of a particular building requires more detailed evidence.

NASA/JPL - NASA Maps Beirut Blast Damage (7 August 2020)NASA Earth Observatory - Scientists Map Beirut Blast Damage (11 August 2020)
What can fit inside a 30-metre cell?
NASA’s product description says each coloured cell covers an area 30 metres by 30 metres. It might contain part of a structure, several structures or the space between them. One red cell therefore cannot be counted as one destroyed building.
The zoom in the video makes those cells easier to inspect. It cannot reveal walls or building boundaries that the source does not resolve. Nor can the absence of colour establish that a place is undamaged or safe.
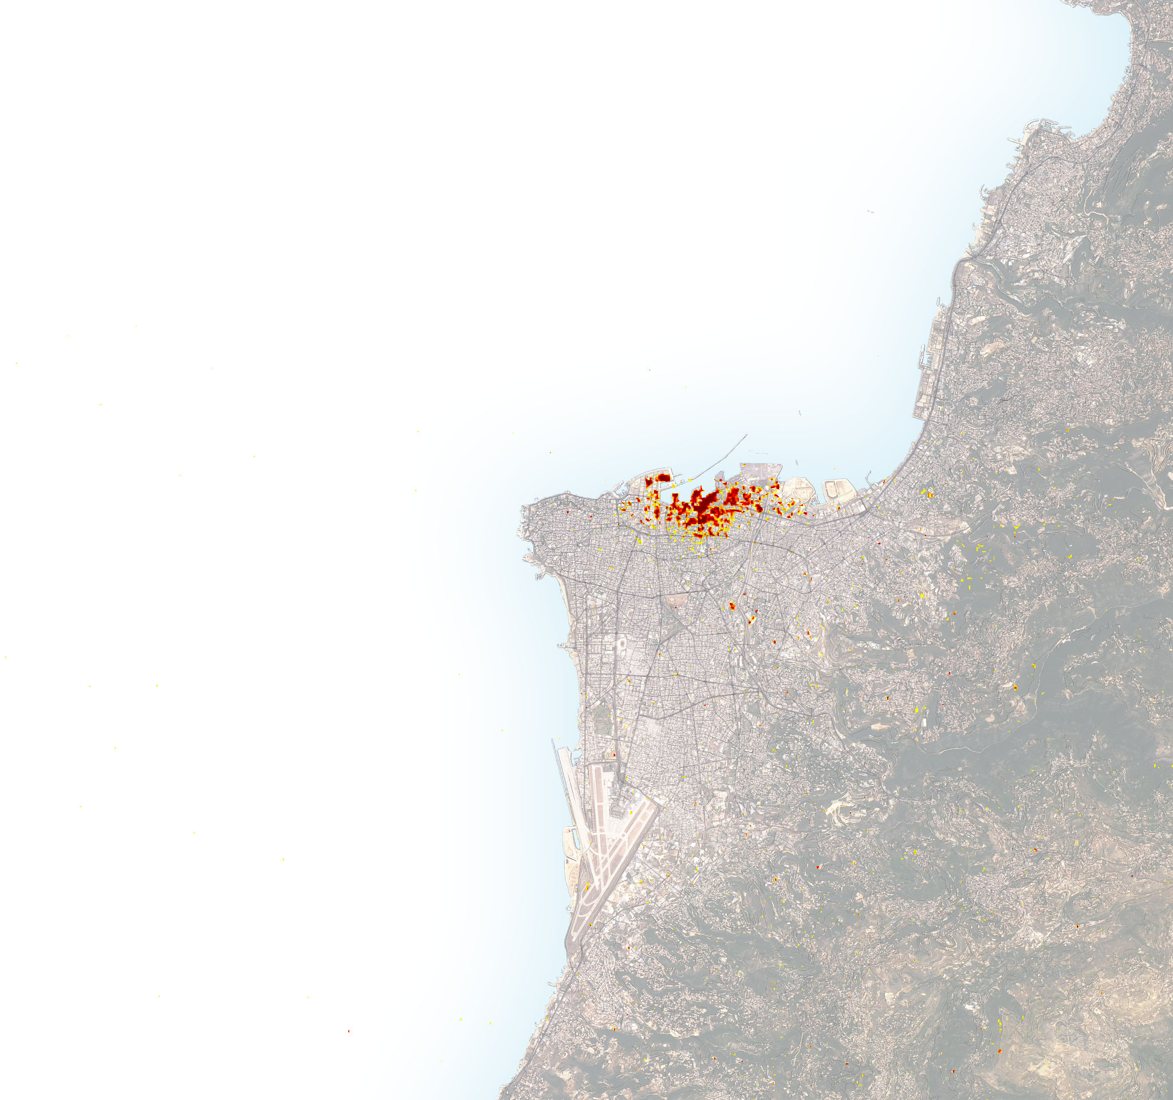
NASA Earth Observatory - Scientists Map Beirut Blast Damage (11 August 2020)
What appears in UNOSAT’s photographs?
Page three of UNOSAT’s preliminary report dated 5 August places WorldView-2 photographs from 31 July and 5 August side by side. It marks visible changes to warehouses. This assessment uses images separate from the ARIA map.
Page four says minor damage may not be visible from space and that the findings had not yet been validated in the field. The photographs support damage around the port, but do not validate every ARIA cell. The DigitalGlobe imagery can be viewed in the original report, linked here rather than copied into this article.
UNOSAT - Preliminary Satellite-Derived Damage Assessment (5 August 2020), PDF
What can we conclude from the comparison?
The map shows likely damage concentrated around the port, helping suggest where to begin an inspection. Establishing each building’s condition, the cause of the explosion or responsibility requires evidence beyond this image.
We compared the dates and scale of the ARIA/EOS map with the observations in UNOSAT’s report. The NASA Earth Observatory image presents the same ARIA analysis, so we did not count it as a second confirmation. We did not reprocess the raw radar data. Image sources and editing steps are recorded in the source package.
NASA/JPL - NASA Maps Beirut Blast Damage (7 August 2020)NASA Earth Observatory - Scientists Map Beirut Blast Damage (11 August 2020)UNOSAT - Preliminary Satellite-Derived Damage Assessment (5 August 2020), PDFNASA - Images and Media Usage GuidelinesNASA/JPL - Image Use Policy
Limits and uncertainty
UNOSAT’s report is also preliminary. The map colours and satellite photographs do not replace a building-level damage assessment or an on-site safety inspection.
Sources
- NASA/JPL - NASA Maps Beirut Blast Damage (7 August 2020)ARIA/EOS product description and credits.
- NASA Earth Observatory - Scientists Map Beirut Blast Damage (11 August 2020)29 July–5 August interval and 30 × 30 metre cell description.
- NASA - Beirut, Lebanon (12 August 2020)Photograph dated 11 August 2020; page published the following day.
- UNOSAT - Preliminary Satellite-Derived Damage Assessment (5 August 2020), PDFComparison on page 3 and limits on page 4 inspected. Copyrighted optical images not republished.
- NASA - Images and Media Usage GuidelinesNASA media guidelines: credited informational use; no institutional endorsement implied.
- NASA/JPL - Image Use PolicyCredited use and no implied institutional endorsement.