
The claim reviewed
Surface change can be measured in satellite images. The counted area depends on the threshold and study boundary.
Source captures
The measured difference
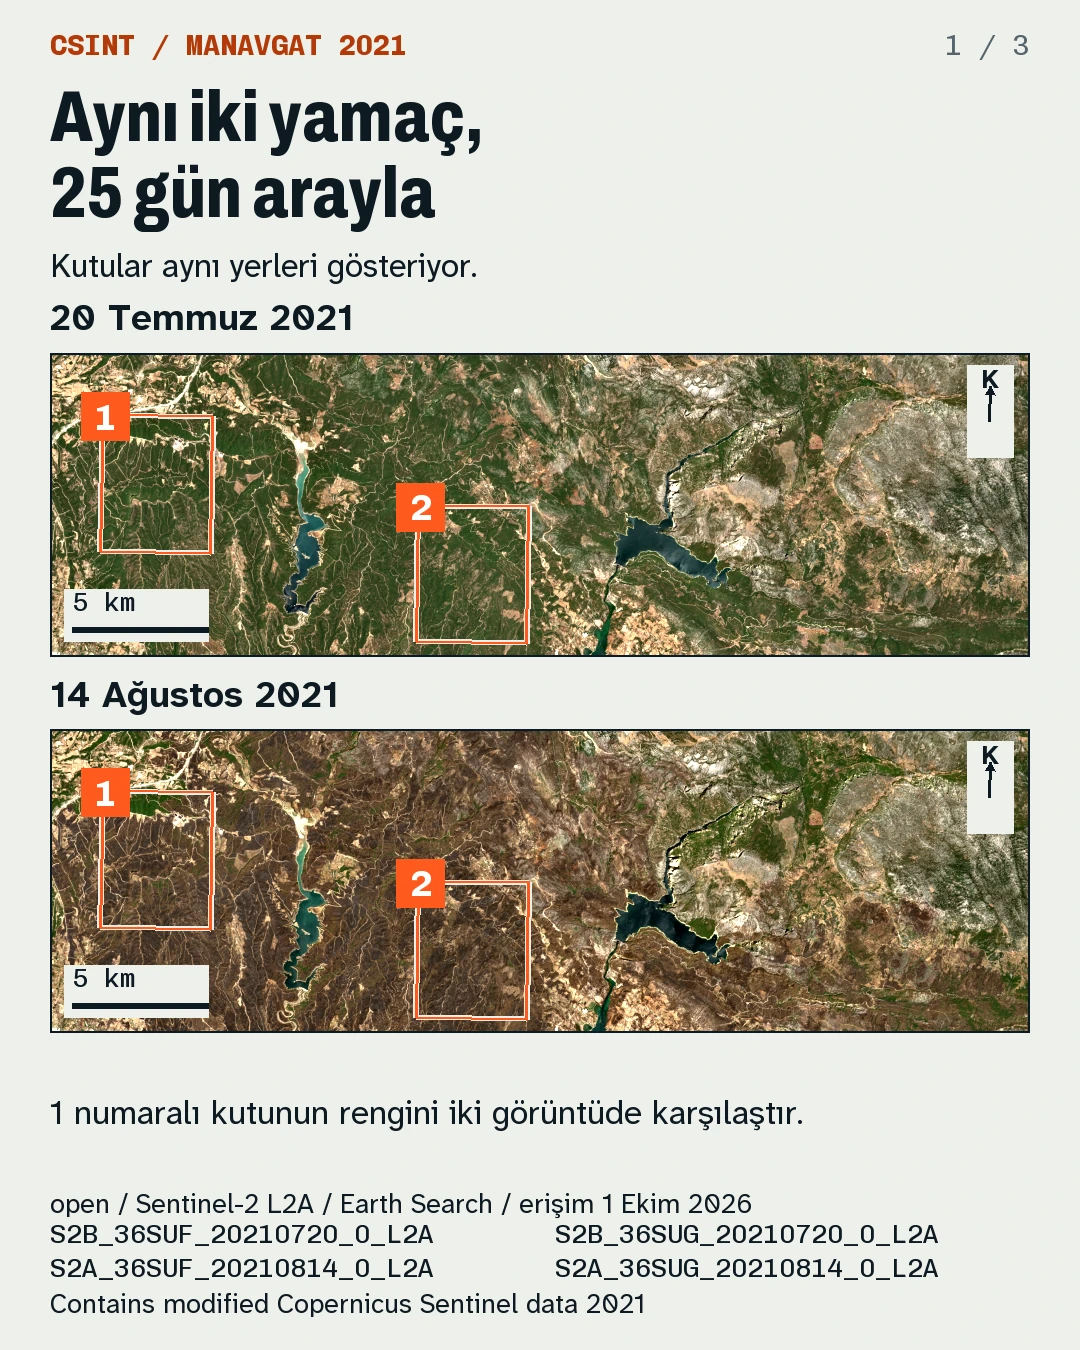
- The images are 25 days apart. The same slopes change from green cover to brown ground.
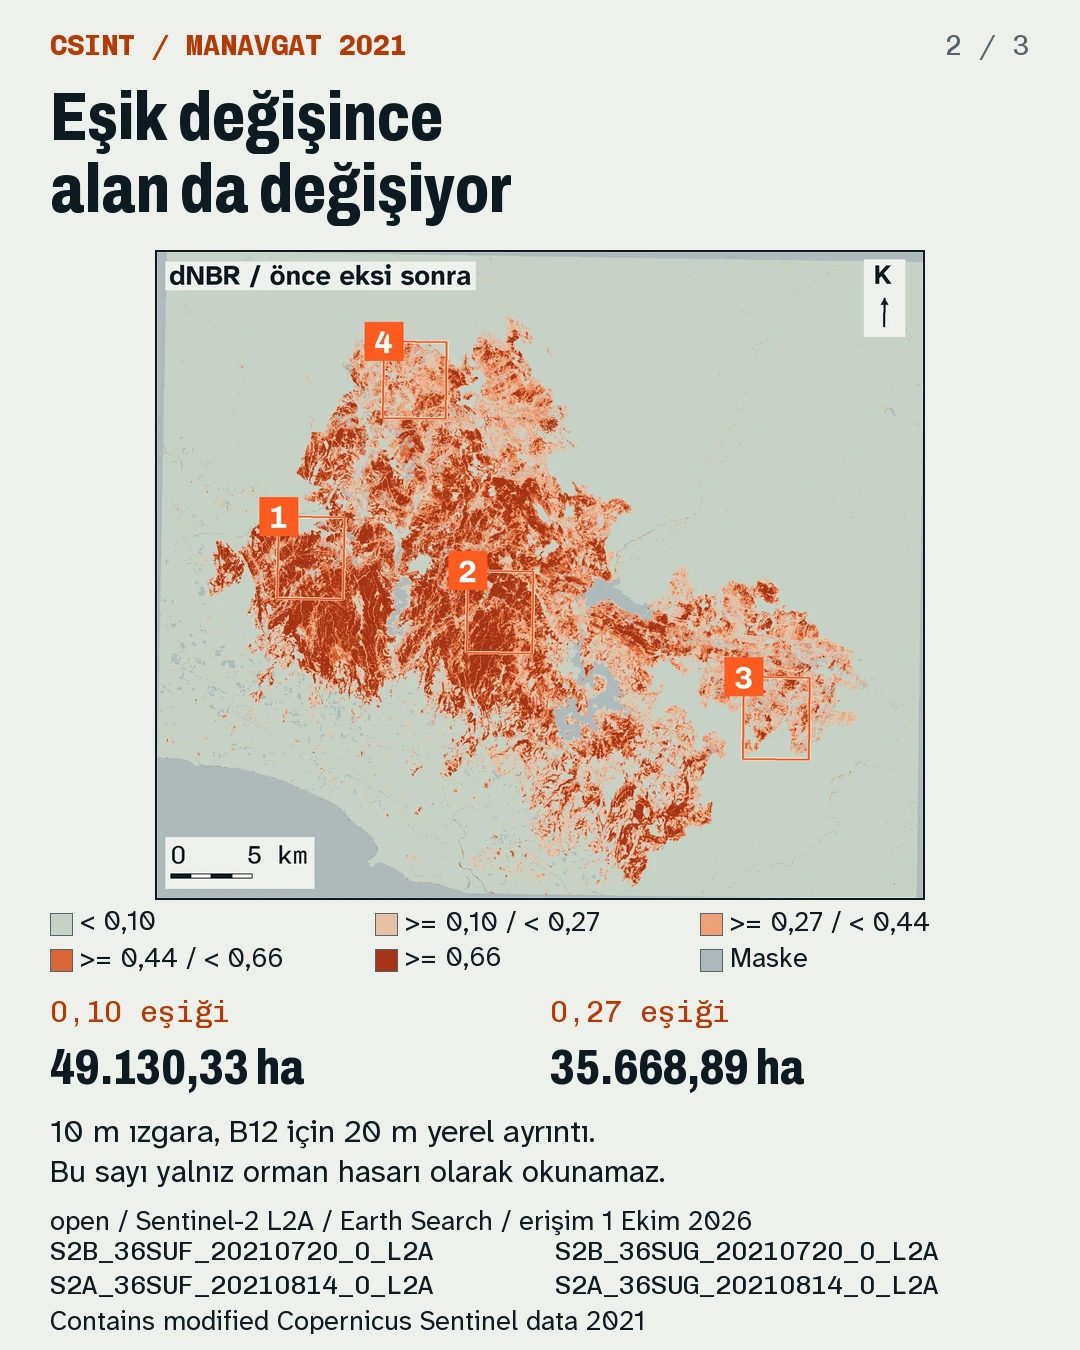
- Choosing 0.27 instead of 0.10 reduces the count by 13,461.44 ha.
1. I compared the same places
open / Sentinel-2 L2A scenes dated 20 July and 14 August 2021 use the same display settings. The study box spans 31.24 to 31.76 east and 36.75 to 37.10 north. Source access: 1 October 2026.
Scene IDs: S2B_36SUF_20210720_0_L2A, S2B_36SUG_20210720_0_L2A, S2A_36SUF_20210814_0_L2A and S2A_36SUG_20210814_0_L2A.
Try it: compare box 1 on the two dates. Check its change against the green areas around it.
2. I chose which cells to count
open / NBR divides the difference between near-infrared B08 and shortwave-infrared B12 by their sum. I subtracted the later NBR from the earlier value to obtain dNBR.
Only SCL classes 2, 4 and 5 on both dates were accepted. On the 10 m grid, one cell is 0.01 ha. Threshold 0.10 gives 4,913,033 cells or 49,130.33 ha; threshold 0.27 gives 3,566,889 cells or 35,668.89 ha.
B12 and SCL have native 20 m detail. Resampling to 10 m adds no detail. The 20 m control gives 49,084.92 and 35,623.04 ha. The count is neither forest-only nor clipped to the EFFIS perimeter. Surface change alone does not prove fire damage in every cell.
3. The sources count different areas
open / OGM reported 59,985 ha on 25 July 2024 across Manavgat, Akseki, Alanya, Gazipaşa, Gündoğmuş and Taşağıl forest districts.
EFFIS record 51931 reports 54,769 ha of perimeter area. Its record date is 28 July 2021 and update date 26 January 2022. These dates do not establish the time the fire ended.
I counted accepted cells above a threshold. EFFIS gives a fire perimeter record. Dates, boundaries and methods differ; the difference alone does not show which number is wrong.
4. I checked the road-side difference
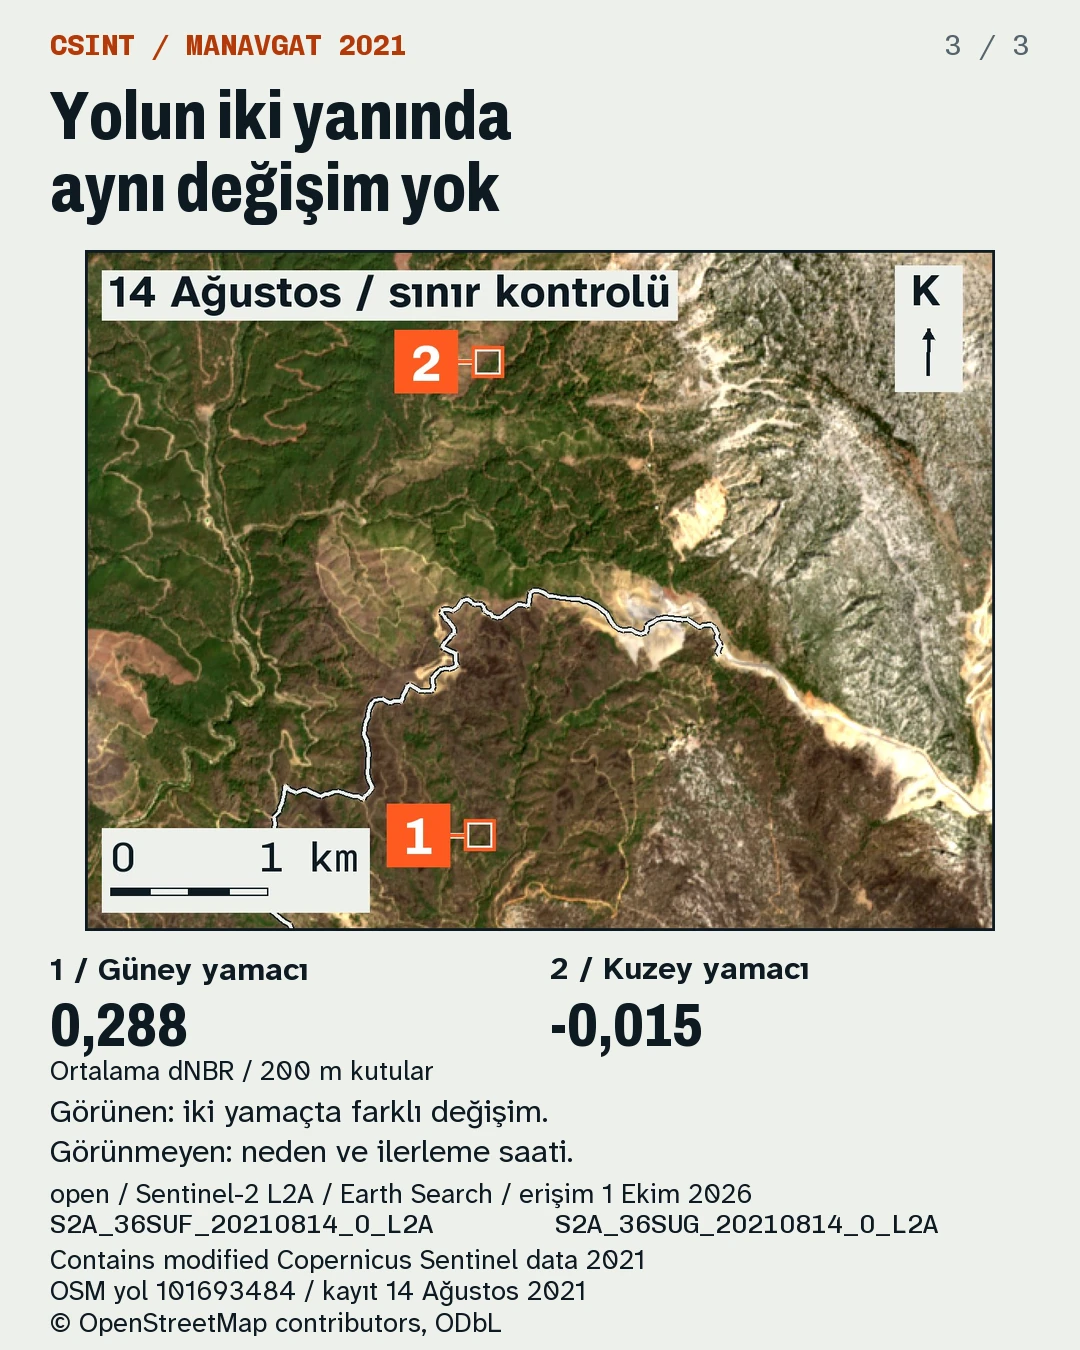
open / I placed the historical OSM road record from 14 August 2021 on the image. The mean dNBR in two 200 m squares is 0.288 on the southern slope and -0.015 on the northern slope.
The two images show different surface change beside the road. They do not establish that the road stopped the fire, its cause or its movement time. This is not a field observation.
What the evidence shows
The images and calculation support these observations.
- Broad surface change between two dates.
- The effect of threshold choice on the area count.
- Different mean change on either side of the road.
What the evidence does not show
The limits of this comparison remain.
- The cause, movement time or whether the road stopped the fire.
- Individual building damage or casualties.
- A count with the same scope as the official forest damage total.
How would you read the map?
Which boundary would you check first on a map like this? The source link below opens the 12-page Turkish case PDF with the reproducible calculation and source records.