
The claim reviewed
How did the large difference between two photographs develop? We return to USGS’s camera sequence covering 14 April–20 August 2018.
Key findings
- As the dates advance, the crater margins and the ground in the foreground change.
- Steam and ash block the view on some days; comparisons need clearer frames.
- USGS reports 62 collapse events. The daily image selection does not show every event separately.
What happened at the summit?
In 2018, the large depression at the summit of Kīlauea in Hawaii, known as a caldera, changed substantially. USGS explains that the eruption in the lower East Rift Zone partly drained the magma reservoir beneath the summit. With less support below, the caldera floor began to collapse.
That explanation comes from USGS’s monitoring work. The camera shows what happened at the surface. Following the images in date order lets us track the crater margins and the surrounding ground.
USGS - 2018 lower East Rift Zone Eruption and Summit Collapse
Four months in a 40-second file
USGS selected roughly one image per day for the video it published on 28 August 2018. Including its opening and closing cards, the file runs for 40.2 seconds. The movement on screen therefore gives no direct sense of the event’s actual speed. We slowed some excerpts and paused on selected frames to show the details.
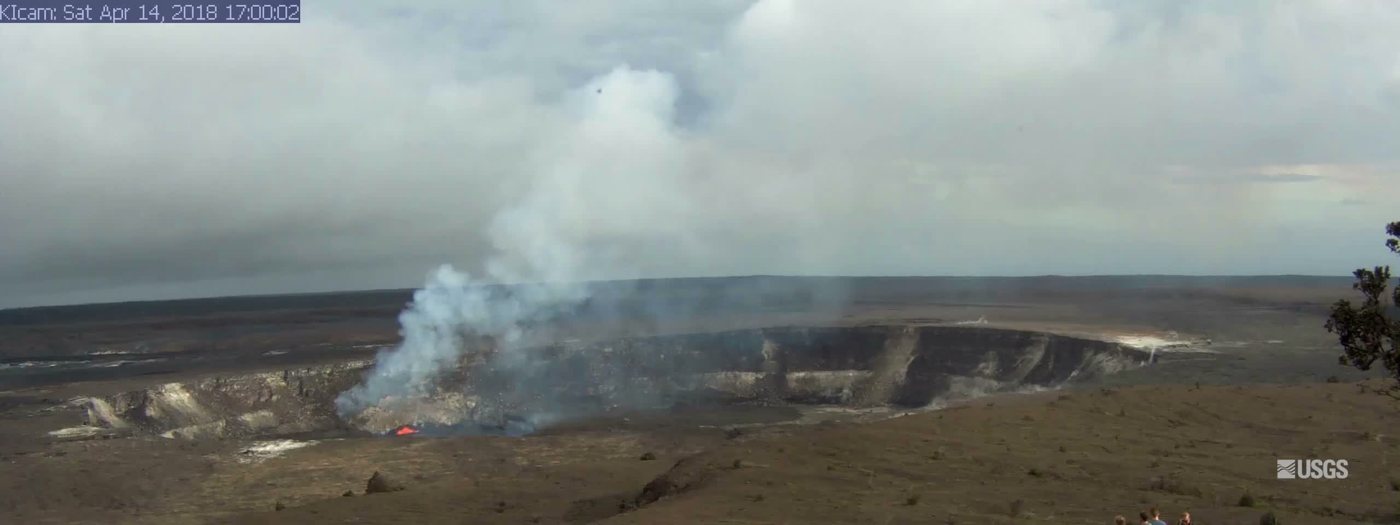
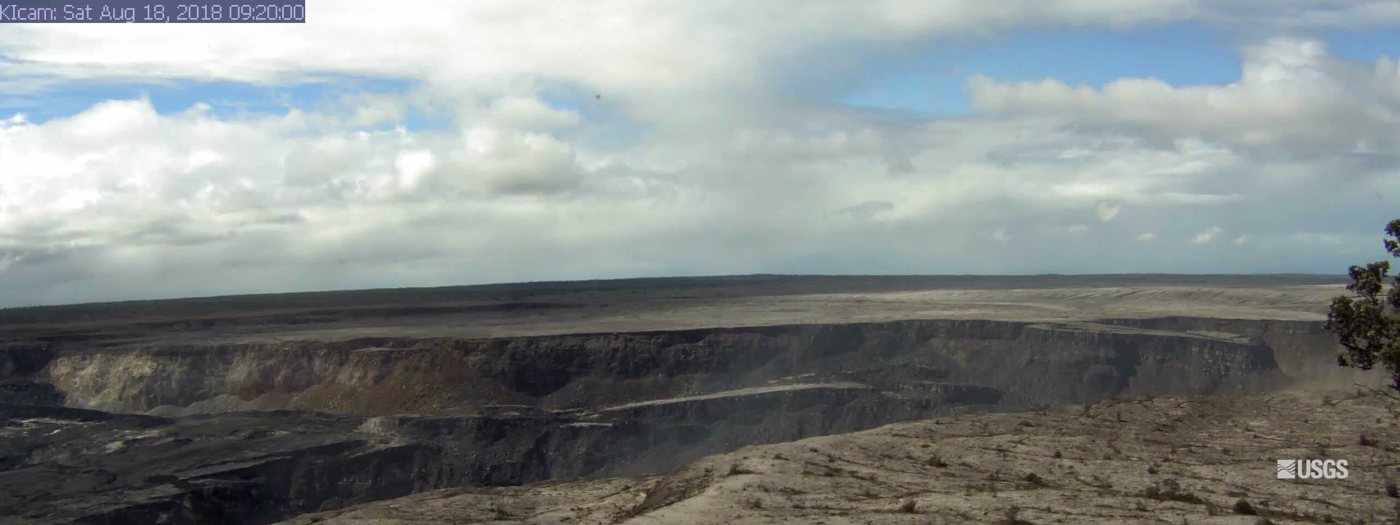
The acquisition date appears in the upper-left corner. The first image in this article is dated 14 April 2018 and the second 18 August 2018. The source video continues through 20 August; the last frame chosen for our still comparison is from 18 August.
Following the crater margin
In the 14 April frame, a small red area beneath the plume helps locate the lava lake. In later images, steam and ash cover parts of the crater. When a margin disappears from view, obscuration needs to be considered first.
We followed the distant horizon and the near crater margin in two clear frames, using the same crop and a moving divider. Neither image was warped. The comparison shows visible changes in the ground; it does not provide a surveyed map alignment.
The 62 collapses reported by USGS
USGS’s overview records 62 summit collapse events, with the last on 2 August 2018. Its 2019 assessment also describes the process. Both texts draw on the same organisation’s observations.
We did not obtain the number 62 by counting video frames. A daily selection can leave gaps between events. The camera sequence shows the surface changing in stages; the event count and underground explanation come from USGS’s records.
USGS - 2018 lower East Rift Zone Eruption and Summit CollapseUSGS - New insights gained from Kīlauea Volcano’s 2018 summit collapses
Returning to the original record
The April and August frames place the starting scene beside the resulting landscape. Watching the daily records between them gives a clearer account of how it changed. Explaining the collapse through one explosion image would leave out much of that process.
The original USGS video is linked below. Excerpt times and speed changes are recorded in the shot list. We preserved the source file with its hash so it can be identified and used again later.
Limits and uncertainty
Lighting and visibility change from day to day. We did not measure depth, volume or speed from the images, and the daily record does not show every collapse. The film cannot establish when a future eruption will occur.
Sources
- USGS - Kīlauea summit (28 August 2018)Downloaded original record; roughly one image/day; explicitly marked Public Domain.
- USGS - 2018 lower East Rift Zone Eruption and Summit CollapseEvent overview dated 24 November 2023; 62 events, final collapse and explanation of the physical connection.
- USGS - New insights gained from Kīlauea Volcano’s 2018 summit collapses2019 assessment. Not counted as an institution independent of the camera record.